Excel Home Budgeting Tool for Hassle-Free Household Budget Management!
KAKEIBO PRO and KAKEIBO LiGHT automatically aggregate income and expense data, allowing you to view monthly and annual tabulation tables at a glance.
Since there is no need for tedious manual work, you can quickly grasp the health and trends of your household finances. Additionally, with the dashboard and trend analysis functions, you can view aggregated values in tables and charts, enabling you to analyze your household finances from various perspectives.
The auto-tabulation features allow you to save time and provide more accurate analysis of your household finances, helping you manage your finances in a planned manner. This guide introduces the features of the dashboard, budgeting, and trend analysis.
Language: English Japanese
1. Dashboard
When you launch the tool, the dashboard will be the first screen you see. It displays your income, expenses, and balances in monthly and yearly tables and charts. Since all the information is shown on one screen, you can understand your household finances at a glance.
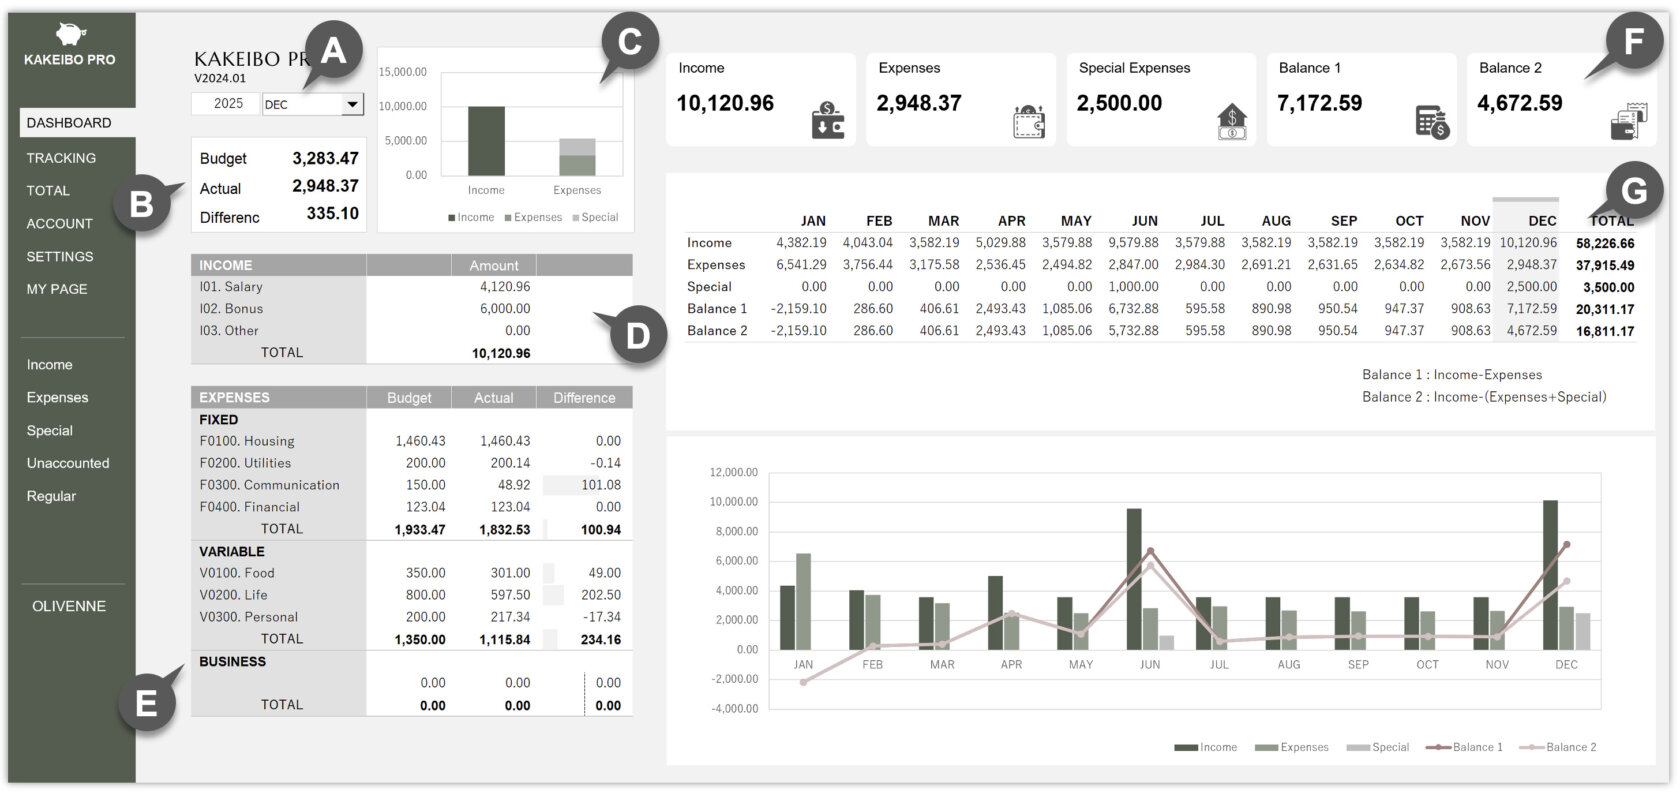
A Specify the Year and Month
Specify the target year and month. The dashboard will automatically calculate the data, allowing you to view the total values for the specified year and month in tables and charts.
B Budget vs. Actual Expenses
It displays the monthly totals for the budget, actual expenses, and the difference (budget – actual expenses) for the specified year and month. You can easily compare the set budget with actual expenses. Any deviation from the budget can be immediately noticed, allowing you to make necessary adjustments.
C Income vs. Expenses
It displays the monthly totals for income and expenses for the specified year and month in a bar chart. The graphical visualization makes it easy to check whether expenses exceed income.
D Monthly Total of Income
It totals the income amount by item for the specified year and month.
E Monthly Total of Expenses and Budget Management
It aggregates the expense amount by category for the specified year and month. It allows you to view the difference between budgeted and actual expenditures in the data bar, so you can quickly grasp how much you are spending against the budget. As actual expenses increase, the data bar becomes smaller.
F Summary
It displays the monthly total of income, expenses, special expenses, and balance for the specified year and month in a list. The large font makes it extremely easy to read.
G Trend Tracking
It aggregates income, expenses, special expenses, and balances for the specified year on a monthly basis, and you can view them in a yearly table and graph. In the annual tally table, it highlights the specified month. Since it visualizes the aggregated values as bar charts and line charts, you can easily track patterns and changes over time.
Balance 1 and Balance 2
Balance 1 is the amount of income subtracted by normal expenses: [Income – Expenses]. Balance 2 is the amount of income subtracted by expenses including special expenses: [Income – (Expenses + Special Expenses)].
2. Budget Management
The tool aggregates daily details by item, allowing you to easily view monthly income and expenses. You can also specify a year and month to compare the balance for that month. It allows you to set a budget for each category and provides a detailed side-by-side comparison of your projected monthly budget vs. your actual expenses.
This summary gives you a quick and straightforward way to identify areas where you may be overspending. Eliminate waste and manage your household finances in a well-planned manner! Here are the steps on how to use the budget management:
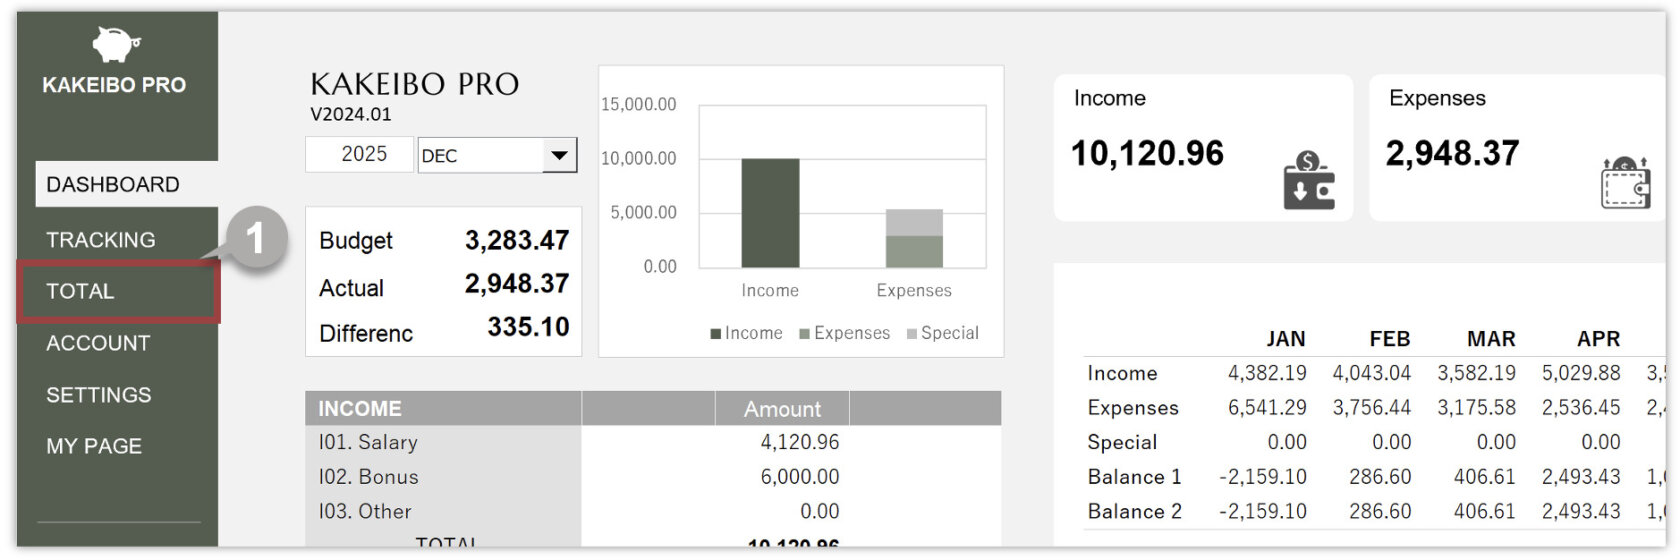
1 Click TOTAL in the main menu, then select Budget under the TOTAL group.
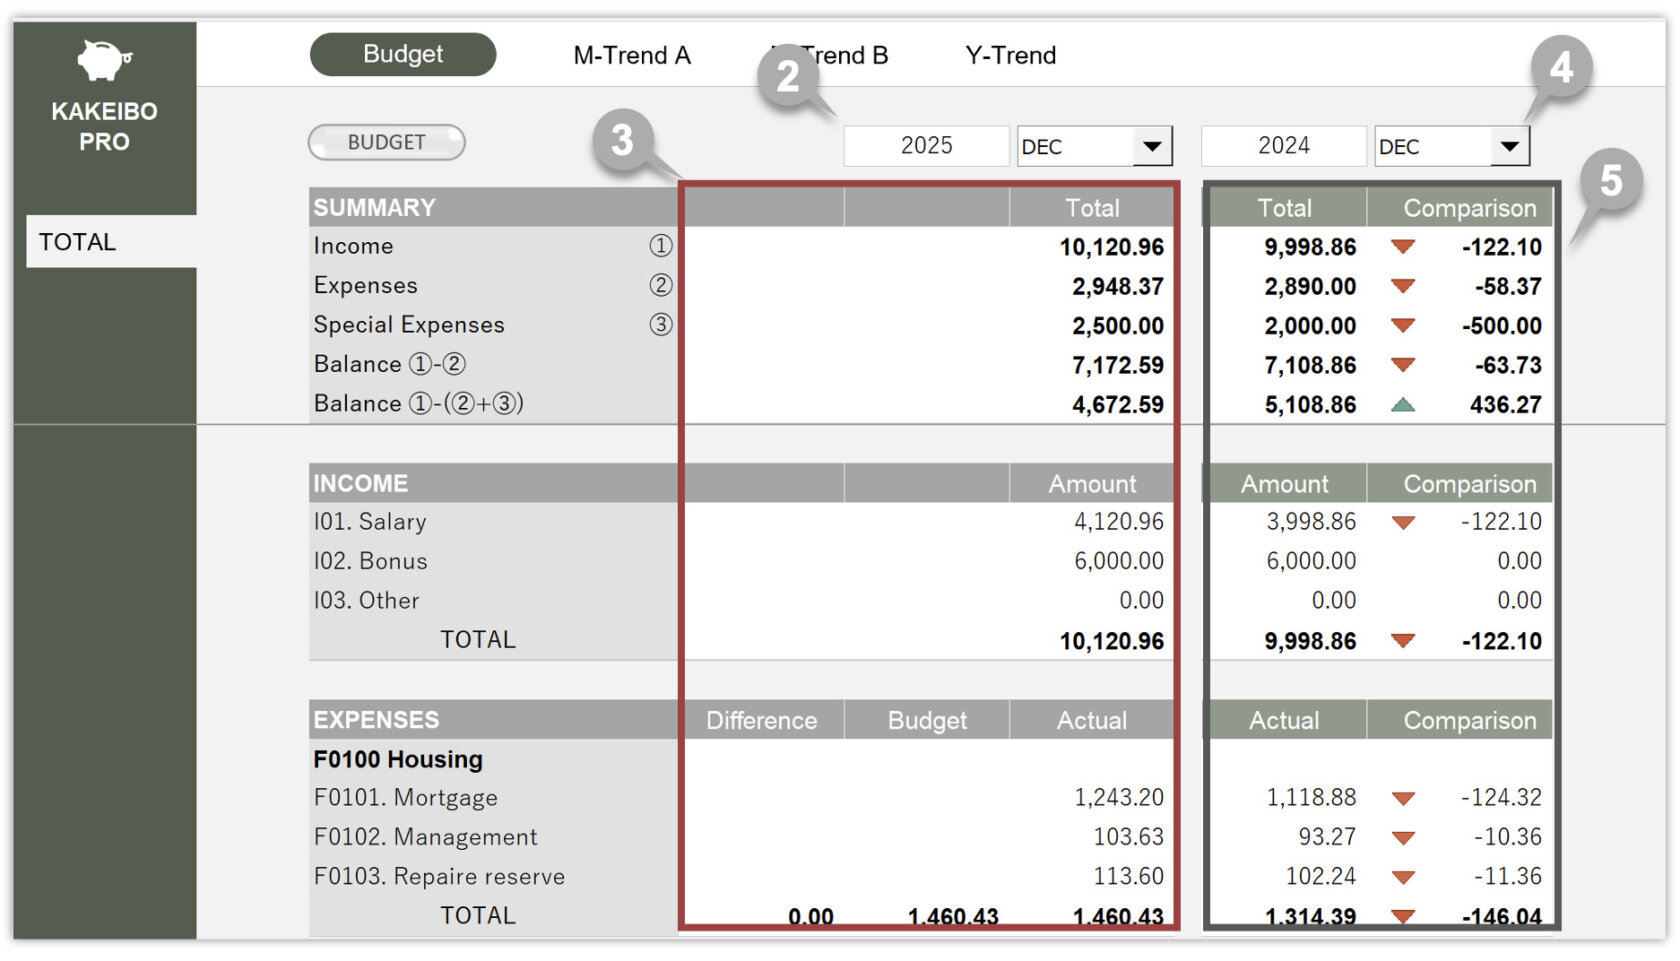
2 Enter the target year and select the month from the drop-down list.
3 The tool will display the aggregated values for the specified year and month.
Compare with a Specific Year and Month
4 Enter the target year and select the month from the drop-down list for comparison.
5 The tool will display the aggregated values for the specified year and month. In the Comparison column, you can view the value compared to the current month: [The specific year and month – The current month].
Edit the Budget
To edit the budget, click the BUDGET button. The Categories sheet will appear, and you can enter the amount in the Budget column.
3. Trend Analysis
You can check the aggregated values in tables and charts, allowing you to analyze your household finances from various perspectives. In addition, the filter function allows you to quickly review itemized data displayed prominently on the graph. This tool provides three analysis sheets: Monthly Trend A, Monthly Trend B, and Annual Trend.
3-1 Monthly Trend A
In the M-Trend A sheet, you can compare the trends of the specified item for up to five different years. You can also specify two items and compare the patterns of each trend. Here are the steps to use it:
1 Click TOTAL in the main menu, then select M-Trend A under the TOTAL group.
2 Choose Income or Expense, then select the target item from the drop-down list.
3 Enter the target year. You can specify up to five years.
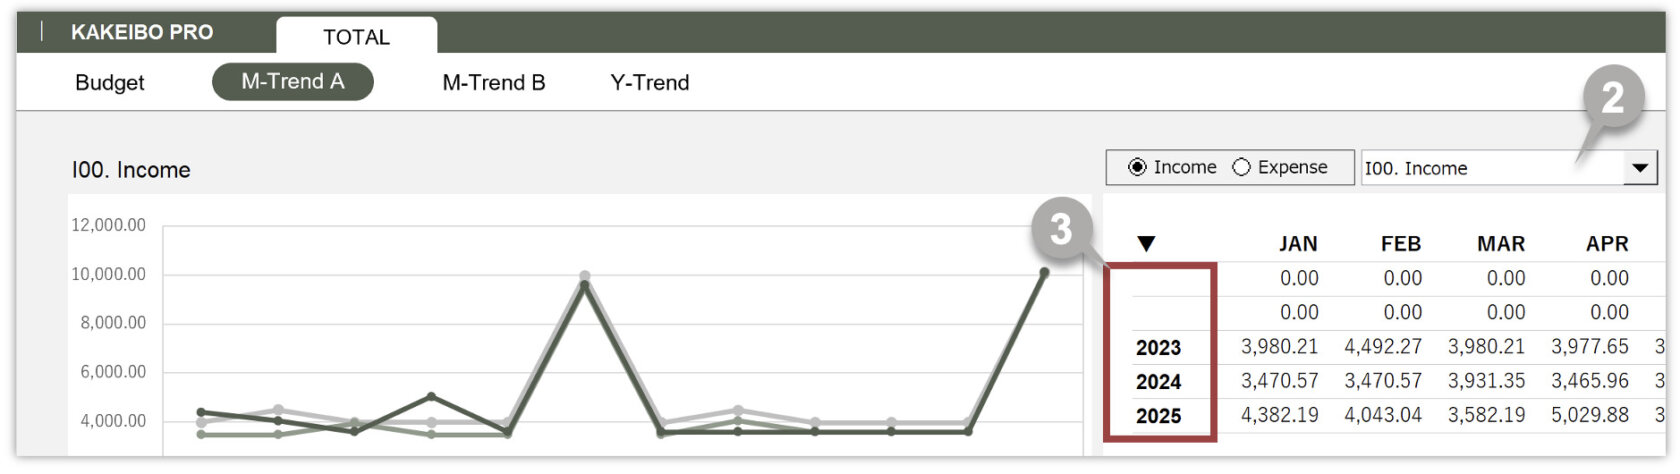
4 The monthly trends for the specified item will be displayed.

Bar and Line Charts
The tool displays the data specified in the first and second rows of the table as bar charts, and the data specified in the third through fifth rows as line charts. For example, you can use a bar chart to display the base year and a line chart to display the years being compared to the base year.
Extract data with Filter Function
You can extract specific item data from income or expense details. This is useful when you want to review itemized data displayed prominently on the graph. To extract detailed data, follow these steps:
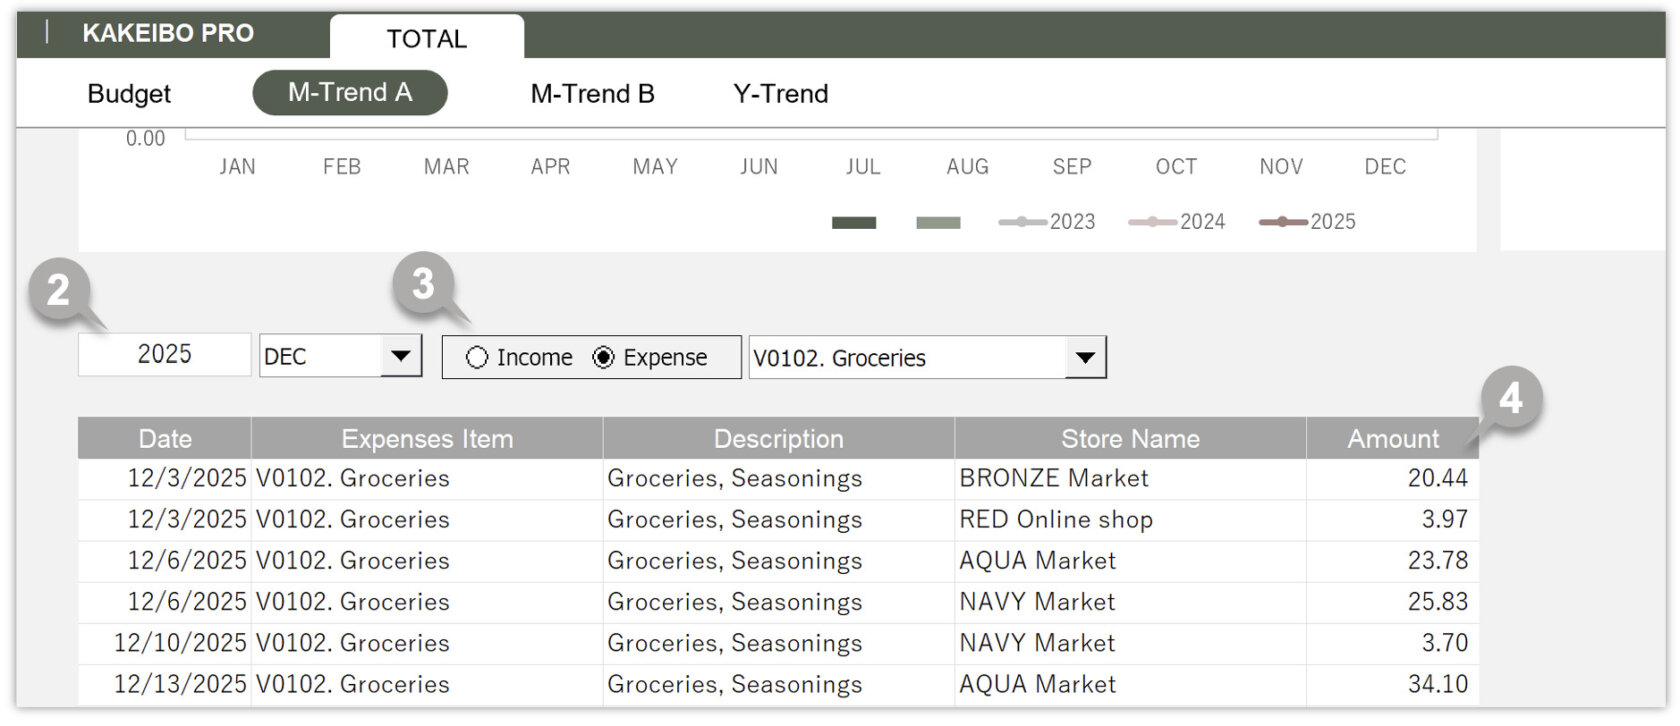
1 Scroll down the screen.
2 Enter the target year and select the month from the drop-down list.
3 Choose Income or Expense, then select the target item from the drop-down list.
4 The tool will display the details that match the specified criteria.
3-2 Monthly Trend B
In the M-Trend B sheet, you can view the monthly trends of up to five items in bar and line charts for income and expenses. This function is useful for understanding how each item trends over time. Here are the steps to use it:
1 Click TOTAL in the main menu, then select M-Trend B under the TOTAL group.
2 Enter the target year.
3 Select up to five target items from the drop-down list.
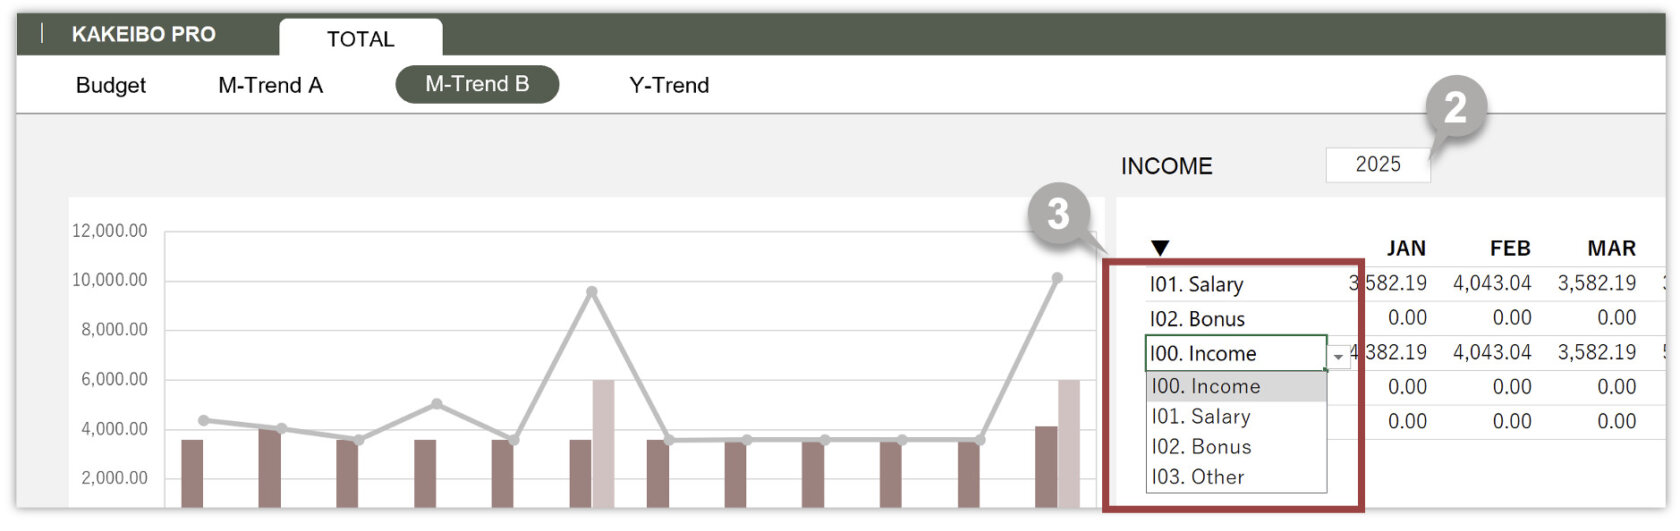
4 The tool will display the monthly trends for the selected items in bar and line charts.
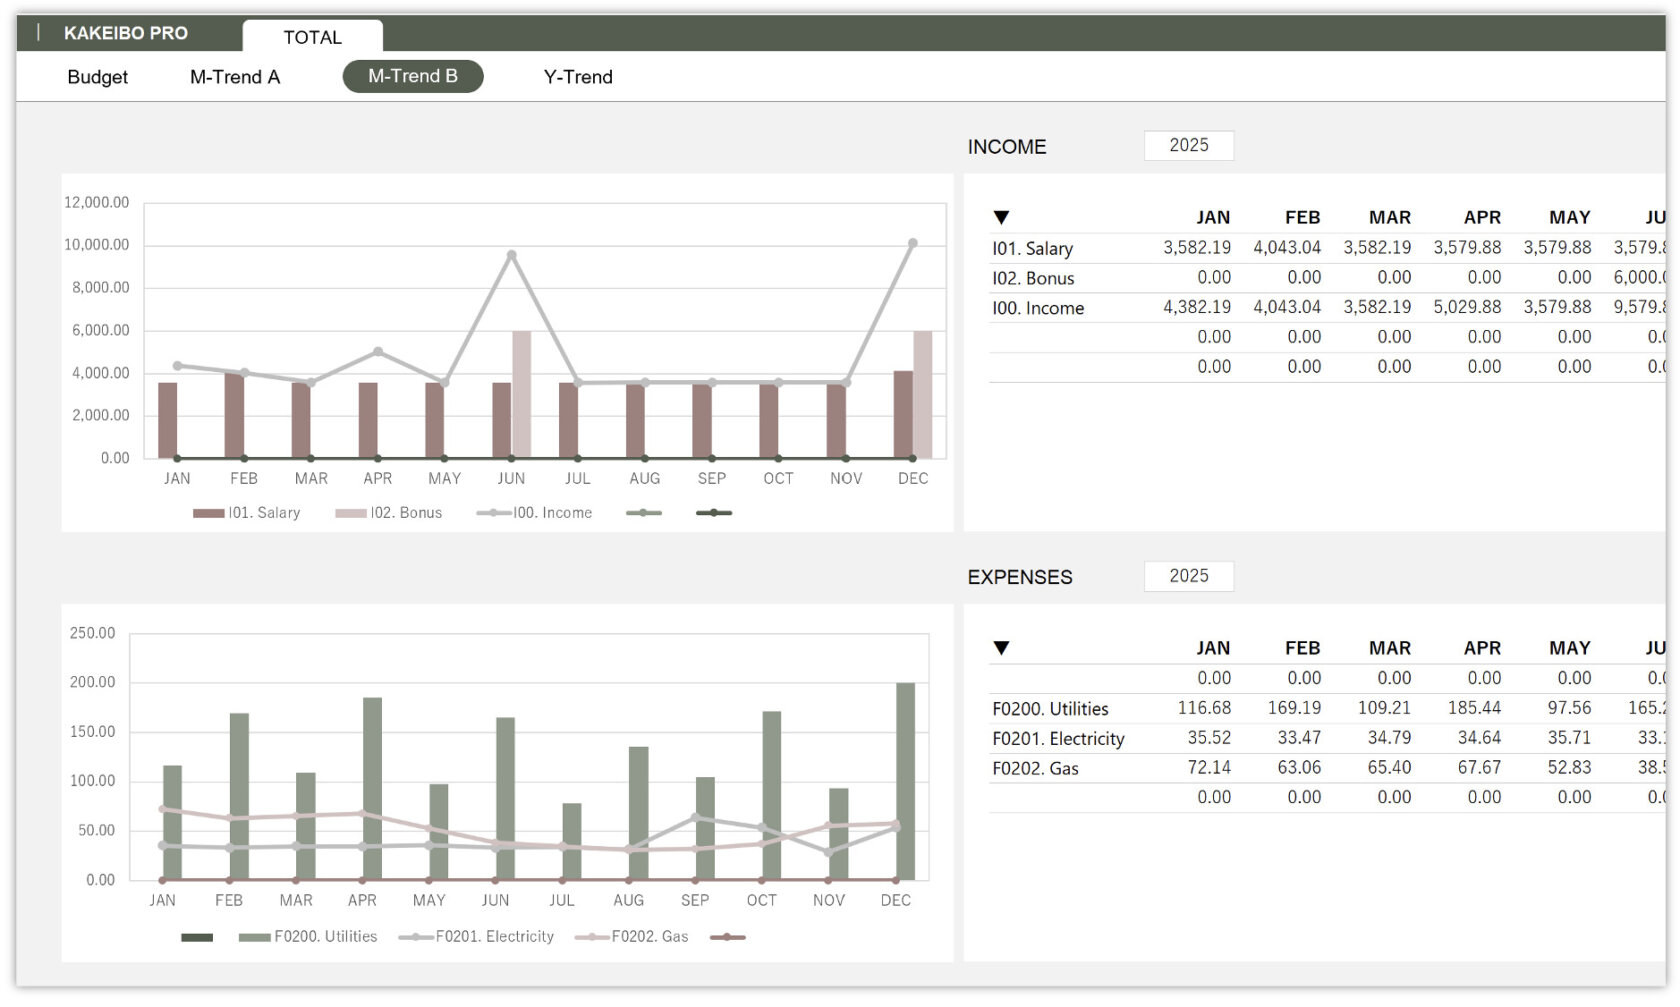
Bar and Line Charts
The tool displays the data specified in the first and second rows of the table as bar charts, and the data specified in the third through fifth rows as line charts. For example, you can display utility costs as a bar chart and electricity, gas, and water as line charts. This makes it easy to see how electricity, gas, and water compare to utility costs.
Extract data with Filter Function
You can extract specific item data from income or expense details. This is useful when you want to review itemized data displayed prominently on the graph. To extract detailed data, follow these steps:
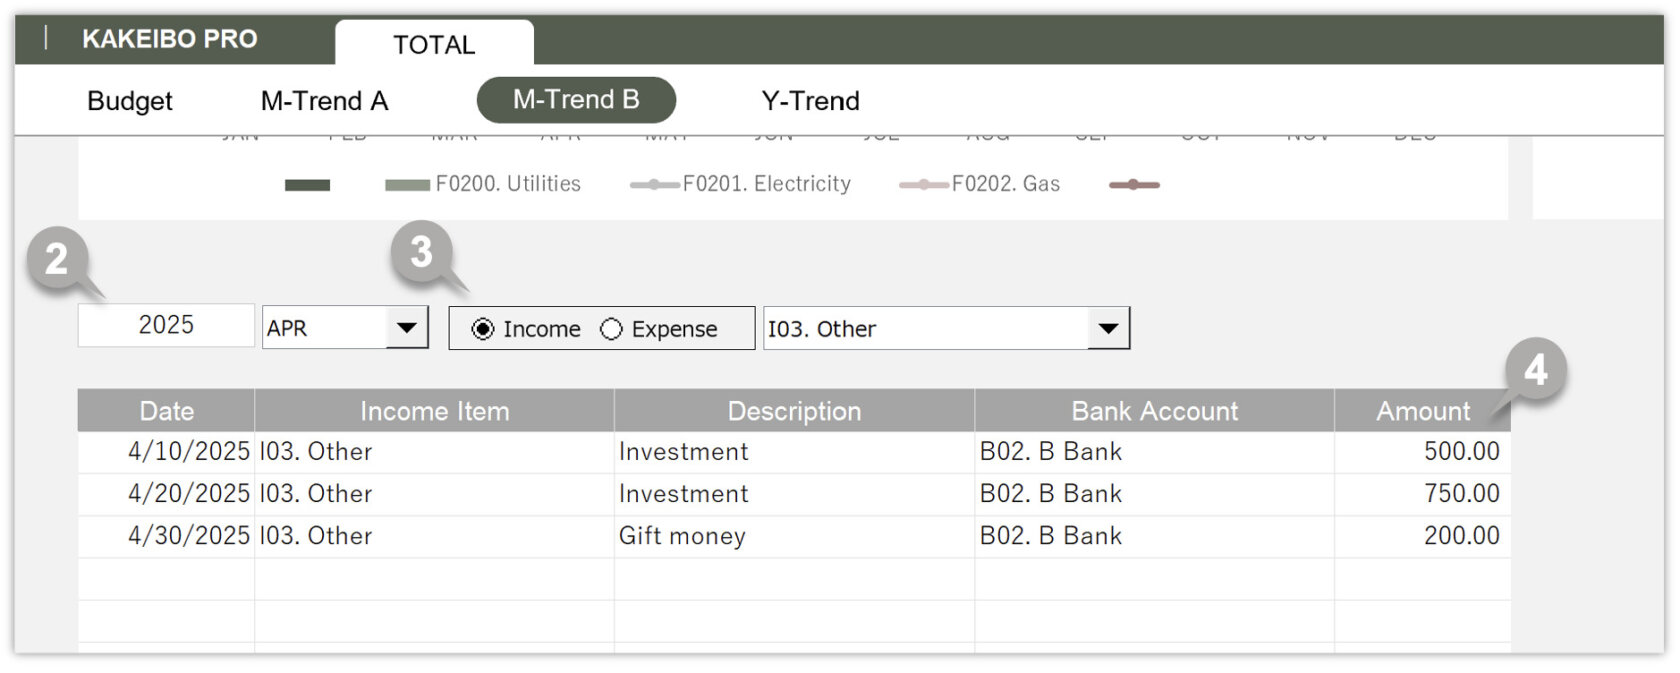
1 Scroll down the screen.
2 Enter the target year and select the month from the drop-down list.
3 Choose Income or Expense, then select the target item from the drop-down list.
4 The tool will display the details that match the specified criteria.
3-3 Annual Trend
In the Y-Trend sheet, you can view the annual trends of up to five items in bar and line charts for income and expenses. This feature is useful for understanding the long-term trends in household finances. Here are the steps to use it:
1 Click TOTAL in the main menu, then select Y-Trend under the TOTAL group.
2 Enter the starting year.
3 Select up to five target items from the drop-down list.
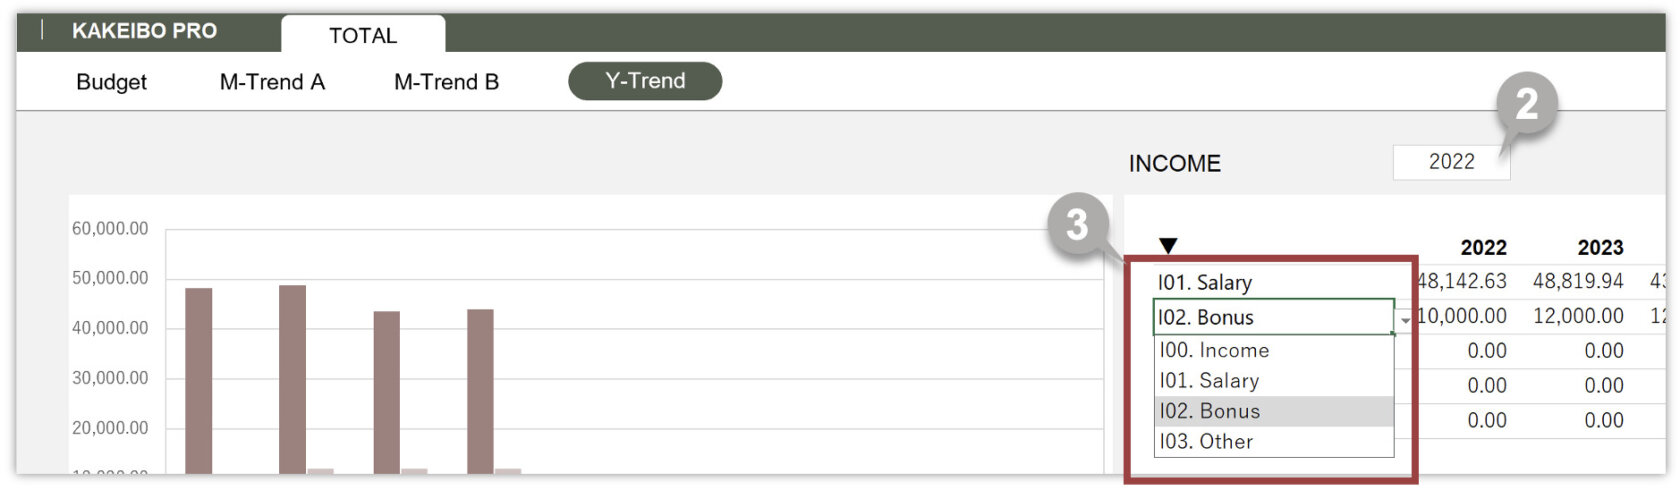
4 The tool will display the annual trends for the selected items in bar and line charts.
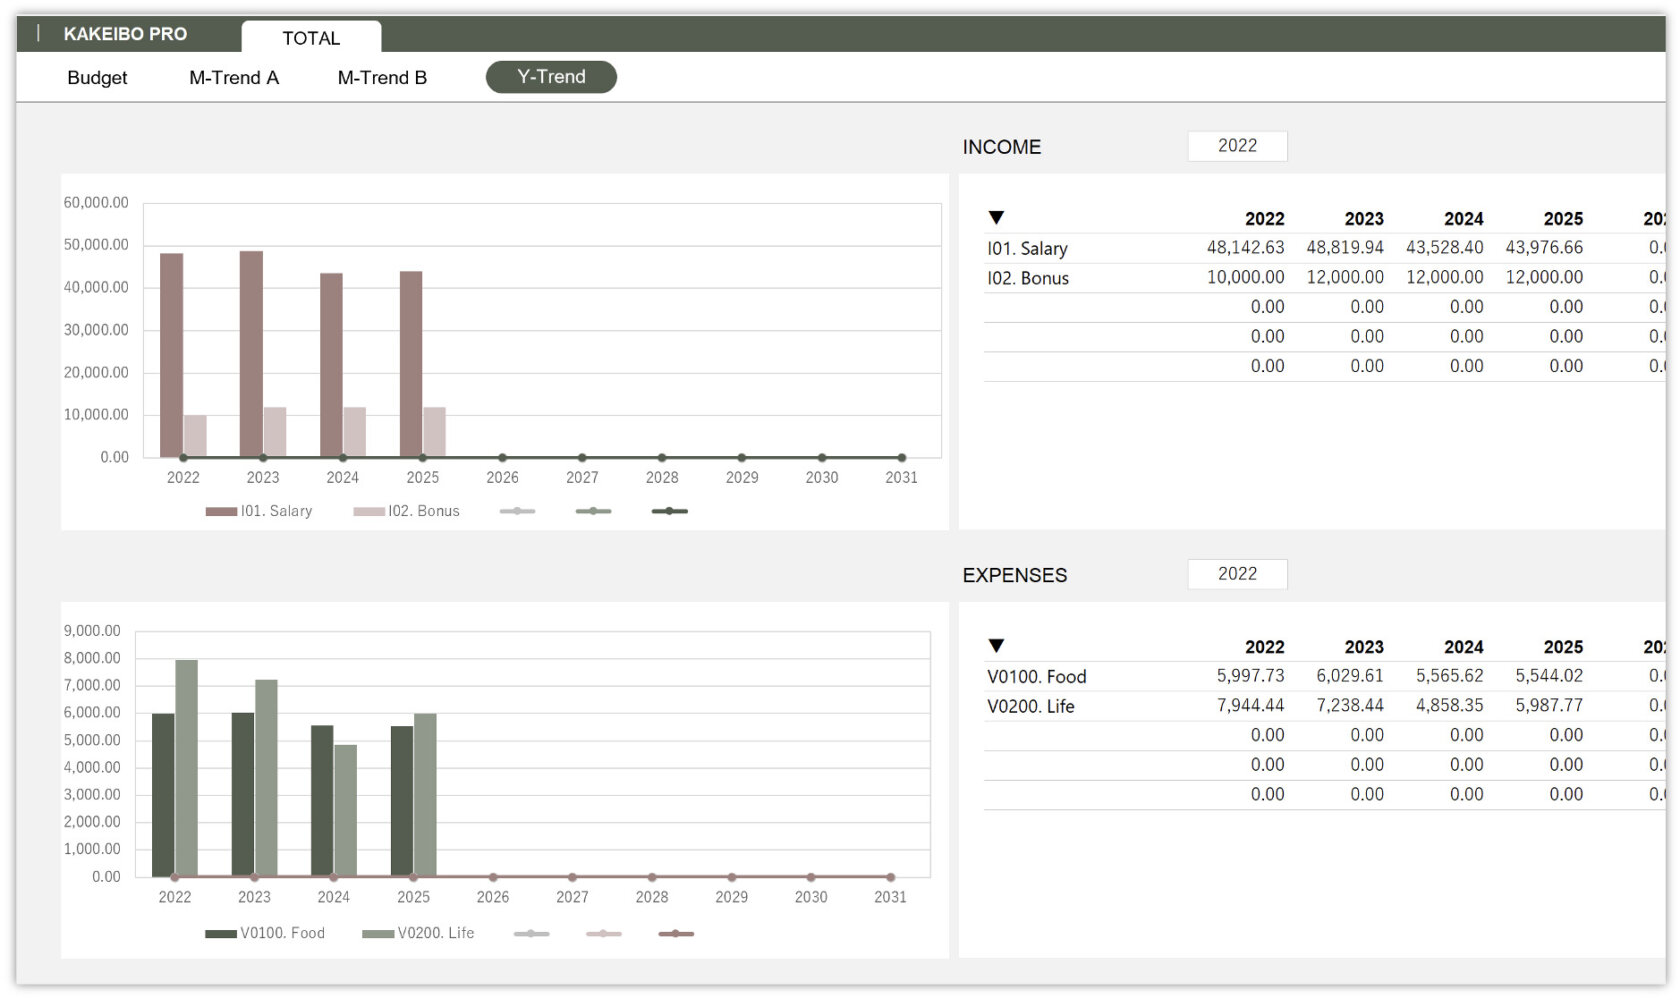
Bar and Line Charts
The tool displays the data specified in the first and second rows of the table as bar charts, and the data specified in the third through fifth rows as line charts. For example, if there is data for fewer than 10 years, you can display it as bar charts. If there is data for more than 10 years, you can display it as line charts.
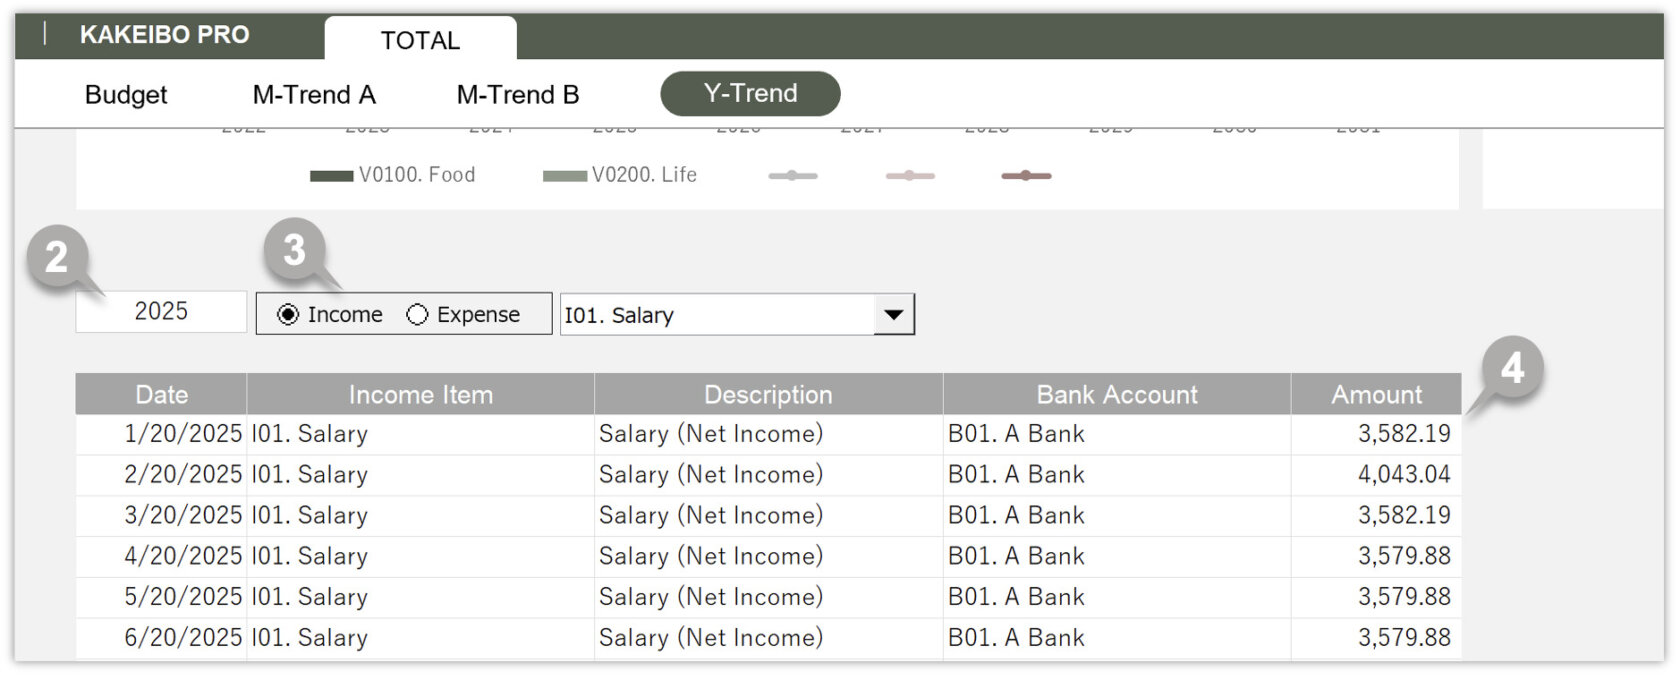
Extract data with Filter Function
You can extract specific item data from income or expense details. This is useful when you want to review itemized data displayed prominently on the graph. To extract detailed data, follow these steps:
1 Scroll down the screen.
2 Enter the target year.
3 Choose Income or Expense, then select the target item from the drop-down list.
4 The tool will display the details that match the specified criteria.
FILTER function
This tool uses the FILTER function to extract data; the FILTER function is available for Microsoft 365 and Excel 2021 or later versions. For more information, see Microsoft the Microsoft Support page.
CONTENTS