“Alright, this is the time I’ll finally stick to my budget!” Have you ever started with that kind of determination, only to find it turning into a simple chore of recording numbers? You collect receipts, enter the data, and end the month with a sigh, thinking, “I’m in the red again…” This may be a familiar experience for many people. Despite spending so much time and effort, managing your money doesn’t get any easier, nor does it lead to actual savings. So, where does the problem lie?
The answer might lie in how you present the data. What if the budget data you’ve been recording could be transformed into a dashboard, just like the gauges in a car’s cockpit, allowing you to grasp your entire financial situation at a glance?
This article provides a thorough guide on how to use a Kakeibo Dashboard, a method anyone can start using without any specialized knowledge. It’s packed with tips to transform your financial management from a tedious chore into an enjoyable process of designing your future.
Language: English Japanese
1. What Is a Kakeibo Dashboard?

First of all, what exactly is a Kakeibo Dashboard? In this chapter, we’ll begin with a basic definition. Using a car’s dashboard as an analogy, I’ll explain its role in managing your household finances in a way that’s easy to understand and visualize.
Furthermore, we’ll explore its true purpose, which goes beyond simply compiling data. The goal is to make your financial management more strategic and effortless. This is the first step in transforming your budget book into a powerful tool that tells you your next move at a glance.
1-1. The Definition of a Dashboard
A dashboard sounds complicated… Isn’t that something in a car? What does that have to do with my budget?
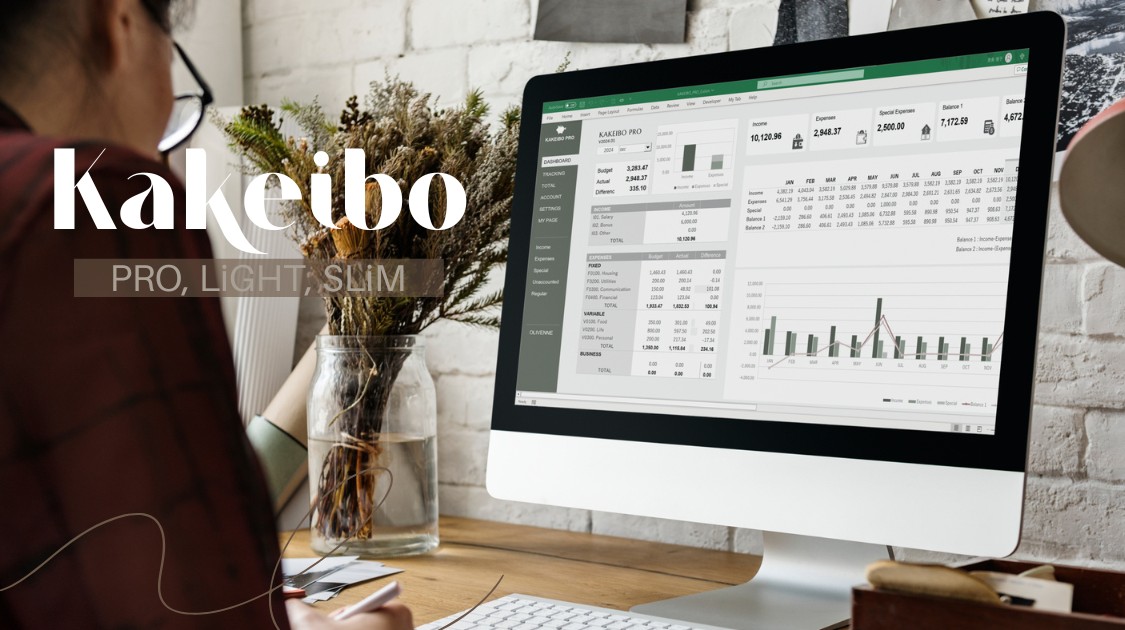
Many of you might be thinking that. Actually, that image is right on track. Just as a car’s dashboard displays crucial information—such as speed, fuel level, and engine status—at a glance, a Kakeibo Dashboard is a screen that consolidates your financial situation so you can understand it at a glance.
Specifically, it aggregates multiple, often scattered, pieces of data—such as monthly income, expenses, savings, and the percentage breakdown of spending categories like Groceries, Hobbies, and Housing—and presents them visually using graphs, charts, and key figures.
Unlike a traditional budget book that is simply a list of numbers, its greatest strength is that it allows you to intuitively grasp your cash flow, much like a financial health report. It serves as your financial cockpit, enabling you to instantly understand the overall health of your finances and identify potential issues without tedious calculations.
1-2. The Purpose of a Dashboard
Okay, I get that it creates nice-looking graphs, but what’s the point? Won’t this just add another complicated step to the already tedious task of budgeting?
It’s true that simply making things look attractive isn’t the goal. The real purpose of a Kakeibo Dashboard is to help you clearly understand your current financial situation and support better decision-making for the future.
If a traditional budget book is a record of the past, a dashboard is a navigation system for the future. It serves three main purposes:
- Quickly Grasp Your Current Status
It instantly answers questions like, “How much more can I spend this month?” or “Am I on track with my savings goals?”—without requiring you to manually search through and calculate every number. - Early Detection of Issues
You can quickly spot financial irregularities by noticing changes in the graphs, such as “My food expenses are unusually high compared to last month” or “For some reason, I’m in the red this month.” This allows you to investigate the cause right away. - Maintaining Motivation to Achieve Goals
When you can visually track your progress toward a goal—such as “saving $10,000 this year”—on a graph, it provides a sense of accomplishment and makes it easier and more enjoyable to maintain daily saving habits.
It’s time to graduate from a “record-and-forget” budget. The Kakeibo Dashboard is a powerful ally that helps you analyze your data and confidently decide on your next step.
2. The Benefits of Using a Dashboard
So, what are the specific advantages of turning your budget into a dashboard? In this chapter, we’ll explore four major benefits that a dashboard offers
From the convenience of seeing your entire financial picture at a glance to the ability to prevent budget overruns, a dashboard provides powerful advantages. Its visual graphs make complex data easy to understand—even for those who aren’t particularly fond of numbers. I’ll also introduce how it can make sharing financial information with your family incredibly smooth and stress-free.
With the power of visual data that makes information intuitive and accessible, your financial management can become smarter, more proactive, and more positive.
2-1. Grasp Your Entire Financial Picture at a Glance
Honestly, calculating my total income and expenses every month is a pain. I have to pull out a calculator and add up everything just to figure out my monthly balance. Isn’t there a way to see it all at once?
A dashboard can eliminate that hassle entirely. Its greatest benefit is, without a doubt, the ability to grasp the full scope of your finances instantly and comprehensively. With traditional budgeting apps or notebooks, information tends to be scattered across separate pages for income, expenses, and assets. A dashboard, however, consolidates all these essential items onto a single screen.
For example, simply by opening it, you can see key figures such as This Month’s Income, Total Expenses, and Current Savings. A pie chart displaying your spending breakdown makes it immediately clear if, for instance, groceries are taking up a large portion of your budget this month.
You can intuitively understand your cash flow and overall financial balance without manually adding up each category. It’s like a CEO reviewing a performance report. Even on busy days, you can assess the health of your finances in just a few moments and make informed decisions.
2-2. Spot Overspending Trends Early
I always regret it at the end of the month, thinking, “I spent more than I realized!” Is there a way to spot the warning signs mid-month and correct my course?
A dashboard can address that problem effectively. Many people experience that end-of-month panic, but using a dashboard makes prevention possible by helping you detect signs of trouble early and take action before it’s too late.
For example, setting up progress bars or gauges that show how much of your budget has been used in each category can be highly effective. What if it’s only halfway through the month, yet your grocery budget is already at 80%?
You would immediately realize, “At this rate, I’m definitely going to go over budget!” That early awareness is crucial. From the moment you notice the trend, you can take specific corrective actions, such as “I’ll cut back on eating out and cook at home more this week” or “I’ll reduce going to the convenience store.”
A dashboard is not just a report of past results. It acts as a reliable radar, alerting you when your financial ship is about to drift off course.
2-3. Intuitive Understanding with Graphs
Honestly, a wall of numbers doesn’t really mean much to me. I want a more intuitive way to understand my family’s current financial situation.
Those who aren’t comfortable with numbers may benefit the most from using a dashboard. Humans naturally process visual information—such as colors and shapes—much faster and more intuitively than text or rows of figures. A dashboard acts like a translator, converting complex financial data into easy-to-understand visual graphs.
For example, when reviewing your expense breakdown:
- A pie chart instantly shows which category is placing the greatest strain on your budget.
- A bar chart makes it easy to compare monthly fluctuations in utility bills and identify seasonal trends, such as electricity costs rising in the summer and gas bills increasing in the winter.
- A line chart tracking your savings balance clearly visualizes your assets growing over time, which can significantly boost your motivation to save.
In this way, the joy of discovering your own spending habits and patterns through visual data—insights you might miss by simply recording numbers—is another major advantage of using a dashboard.
2-4. Easy to Share with Family
I feel like I’m the only one putting effort into managing our finances. I want my husband to be more involved, but when I show them a detailed budget book, He just tune out.
Managing household finances often falls on one person’s shoulders, even though it’s a matter that concerns the entire family. One reason for this is the difficulty of sharing information effectively. When presented with a dense ledger full of numbers, your partner may not know where to focus and may quickly lose interest.
A dashboard, however, can solve this problem by transforming complex financial data into a clear, visual report that anyone can understand.
Conversations become smoother and more productive when you can look at a screen filled with easy-to-read graphs together and say, “Here’s our income and expenses for this month,” or “This is the category where we spent the most.” Because the key points are visually highlighted, you can quickly get on the same page.
This often leads to more cooperative and positive discussions, such as, “Let’s both be more mindful of this area next month.” In this way, a dashboard becomes a powerful communication tool that elevates financial management from a “personal task” to a true “family project.”
3. KAKEIBO Tools with Dashboards

You may understand the benefits of a dashboard, but now you might be wondering, “How do I actually create one?” or “Are there any recommended tools?”
This chapter is here to answer those questions. I will introduce the KAKEIBO series, a set of ready-to-use budgeting tools that I developed by leveraging my years of experience in household budgeting along with my knowledge of Excel.
I’ll explain the features of both the advanced and simplified versions, so you can choose the one that best fits your needs and budgeting style.
3-1. KAKEIBO PRO and LiGHT
If I’m going to manage my finances, I want to analyze the data thoroughly and eliminate as much waste as possible. Is there a tool that lets me track my finances in detail, almost like a professional accountant?
For those who are serious about managing their finances through detailed analysis, KAKEIBO PRO and KAKEIBO LiGHT are the perfect fit. These are high-functioning Excel budgeting tools into which I’ve incorporated all the features I’ve ever wished for in a household finance system.
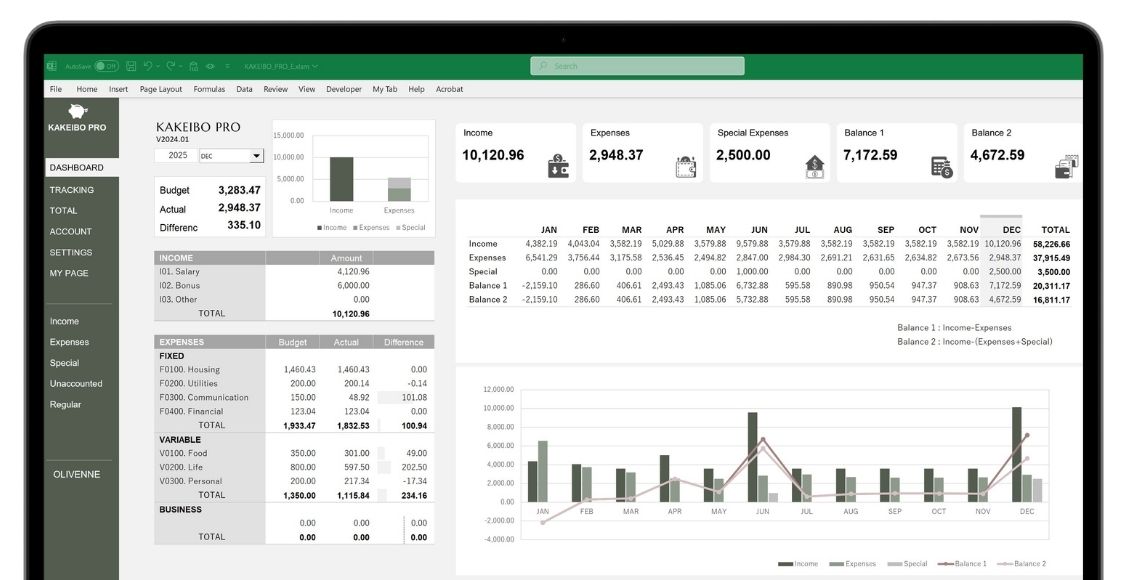
When you open the dashboard, you can immediately see your monthly progress through a clear “Budget vs. Actual Spending” overview. In addition, a graph illustrating the balance between income and expenses—along with detailed spending data broken down by category—allows you to dig deeper and identify the root causes of any overspending.
One particularly useful feature is the data bar, which visually represents the difference between your budgeted and actual spending. This makes it easy to see at a glance which categories are within budget and which have exceeded their limits.
Furthermore, the Trend Tracking feature charts the monthly progression of income, expenses, special expenditures, and overall balance. This enables you to analyze your finances from a broader, yearly perspective and develop long-term improvement strategies. These tools are ideal for anyone who wants to elevate their budgeting to a more structured, data-driven level of financial management.
3-2. KAKEIBO SLiM
A feature-packed tool sounds overwhelming, and I’m not sure I can stick with it. Is there a simple way to get started while still covering the essential points for improving my finances?
I completely understand that feeling. When it comes to budgeting, consistency is the most important factor. That’s why I developed KAKEIBO SLiM—for those who value simplicity but still want to take meaningful steps toward improving their finances. This tool removes complex features and focuses only on the elements truly necessary for financial improvement.
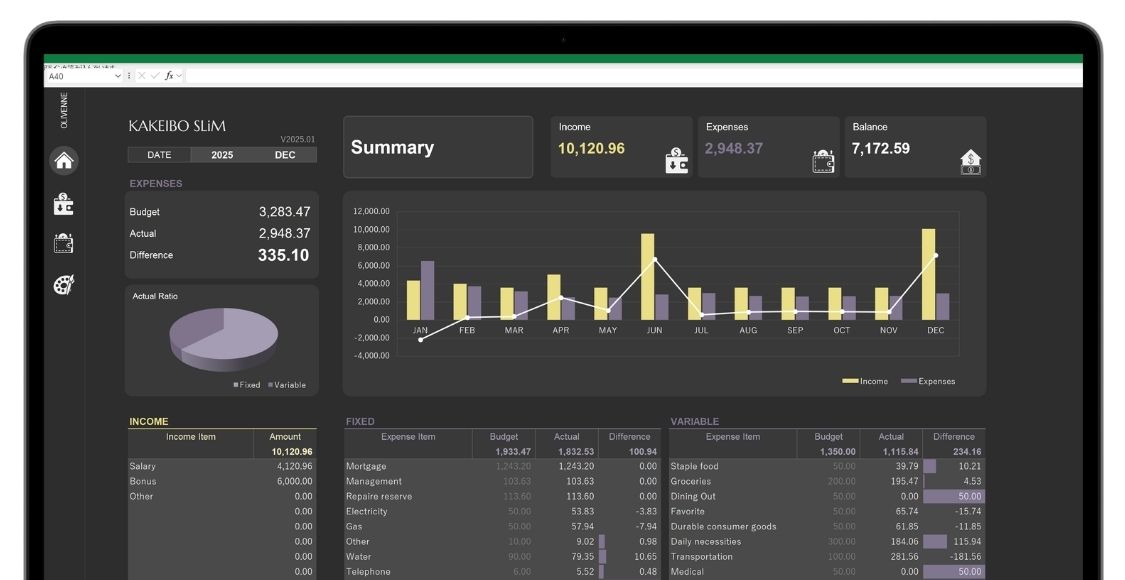
The dashboard includes essential functions such as budget management and income-and-expense summaries. Its standout feature is a pie chart that displays the ratio between fixed costs and variable costs. When reviewing your finances, the first place to focus is often the variable costs you can control. This graph instantly shows their proportion within your budget, making it easier to create a concrete action plan, such as, “Let’s start by focusing on this area.”
It also includes a feature for tracking annual income and expense trends, allowing you to monitor long-term progress through simple operations. I confidently recommend this tool for beginners or anyone who wants to make steady, sustainable improvements to their financial habits.
4. Conclusion
In this article, we’ve covered everything from the basics of a Kakeibo Dashboard to its specific benefits and ready-to-use tools that can dramatically streamline your financial management.
A Kakeibo Dashboard transforms the simple task of recording expenses into a strategic practice—one that allows you to understand your entire financial situation at a glance and proactively plan for the future. Just as a driver checks the gauges in a car to assess road conditions, you can intuitively monitor your cash flow from your own financial cockpit.
It may seem challenging at first, but with tools like the KAKEIBO series, anyone can begin practicing smart, data-driven financial management today.
Let the tools handle the tedious work so you can focus on what truly matters: shaping a healthier and more intentional relationship with your money. I hope this article serves as your first step toward making financial management more engaging—and guiding you toward a more secure and prosperous future.
Related Articles