I update my household budget book every day by checking my receipts, but somehow I never have any money left at the end of the month…
Even when I review the figures I’ve recorded, I still don’t know what I should do to save more money next month!
In fact, simply recording your income and expenses in a household budget book is not enough to help you save money. What truly matters is comparing and analyzing the data you have collected, then using those insights to improve your spending habits in the following month.
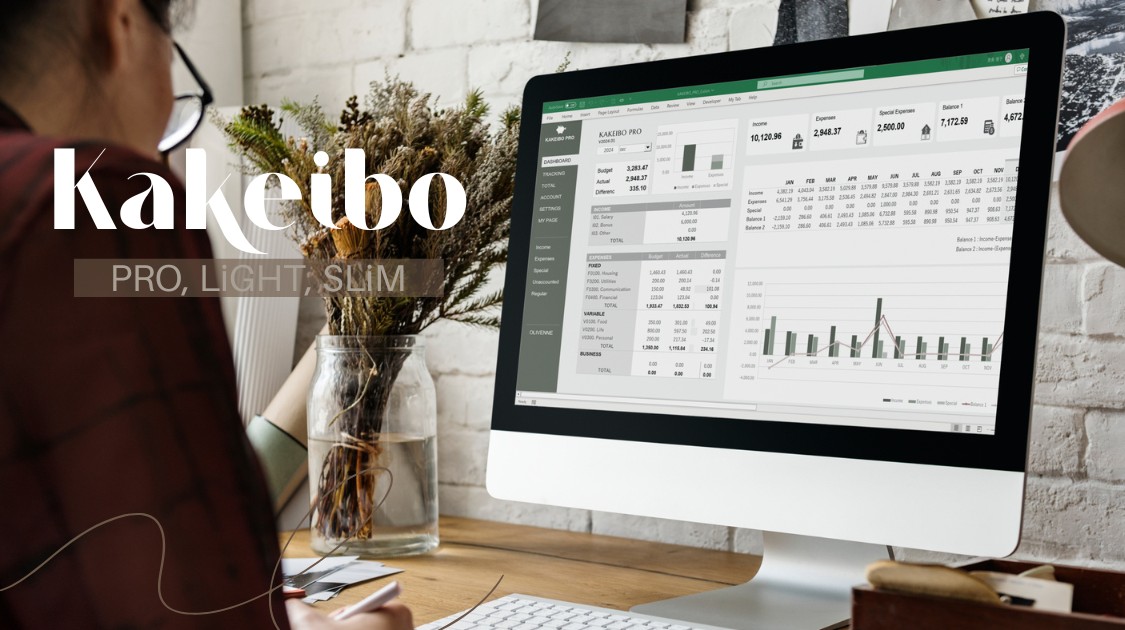
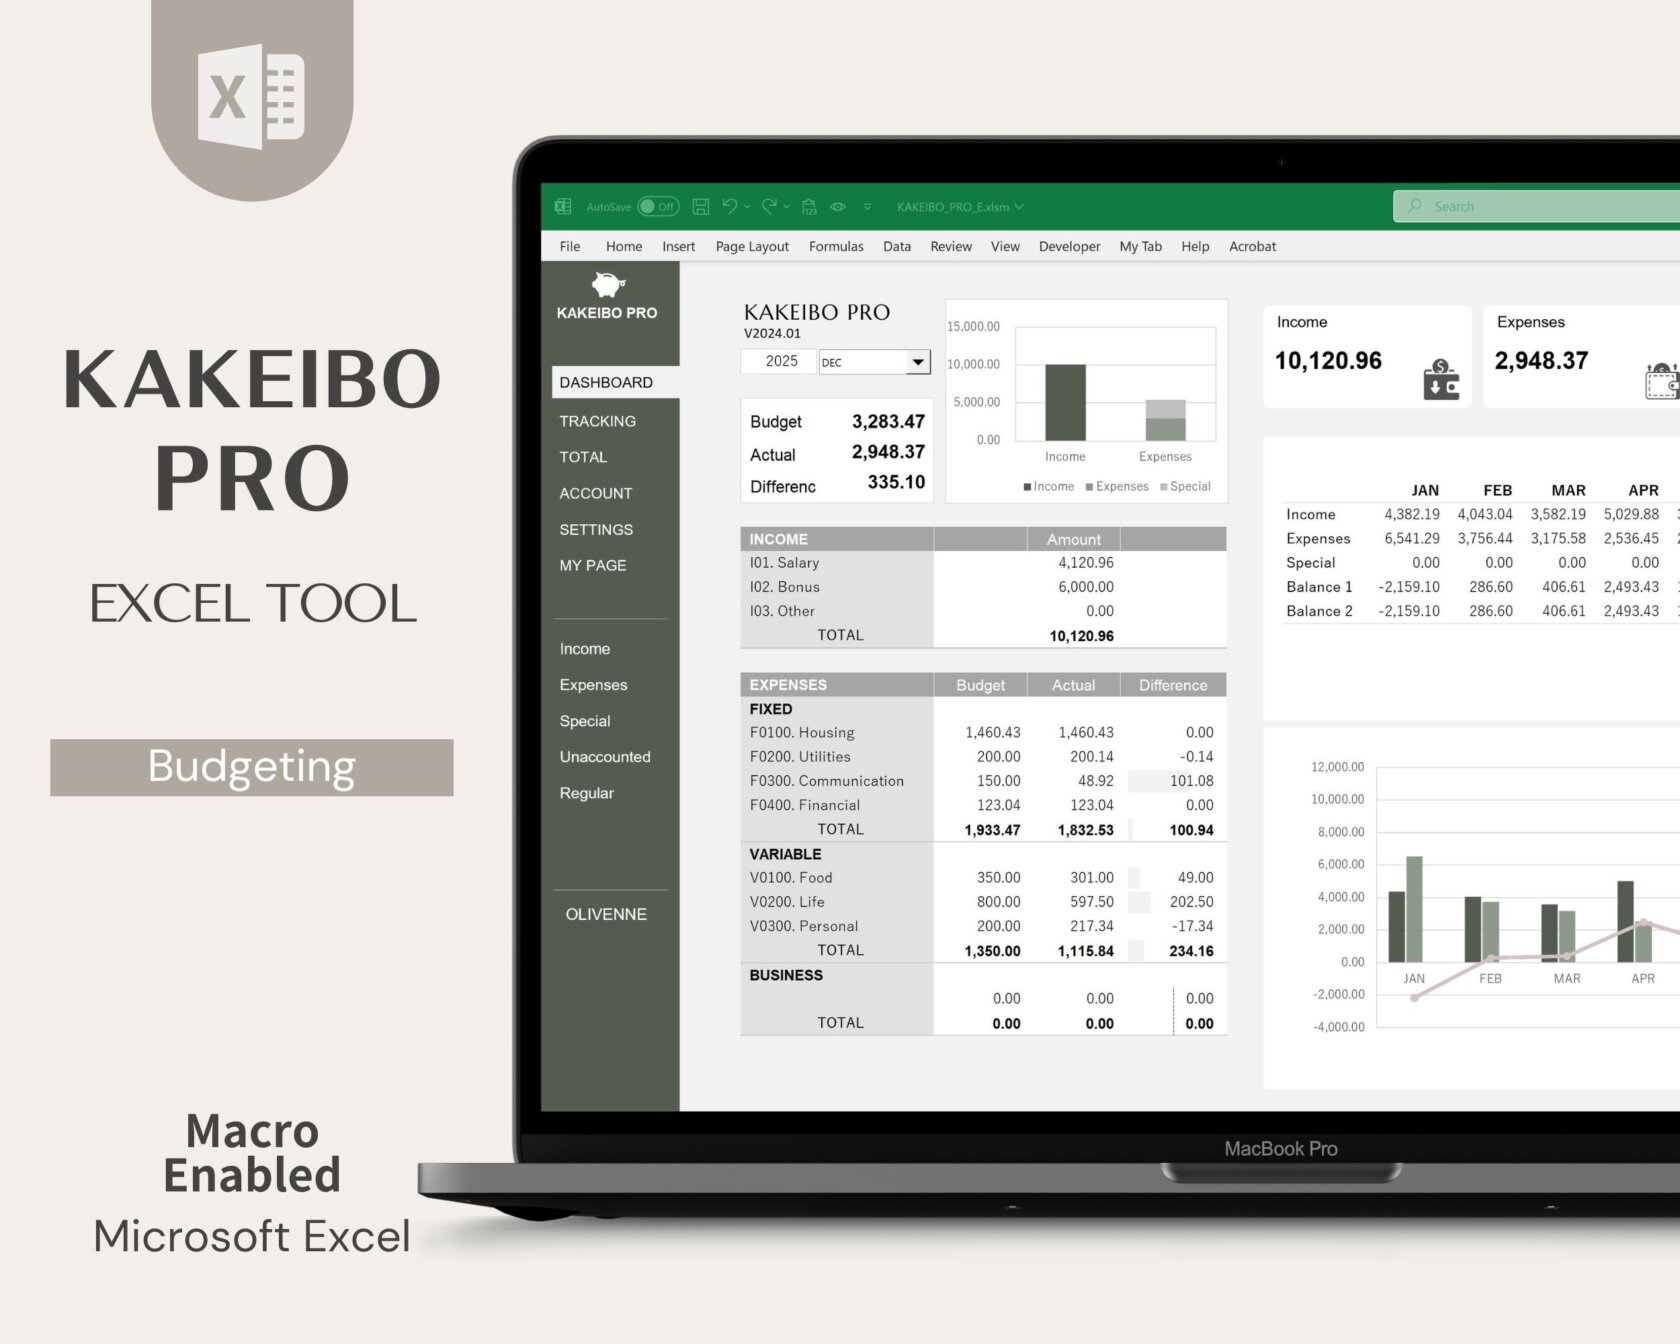
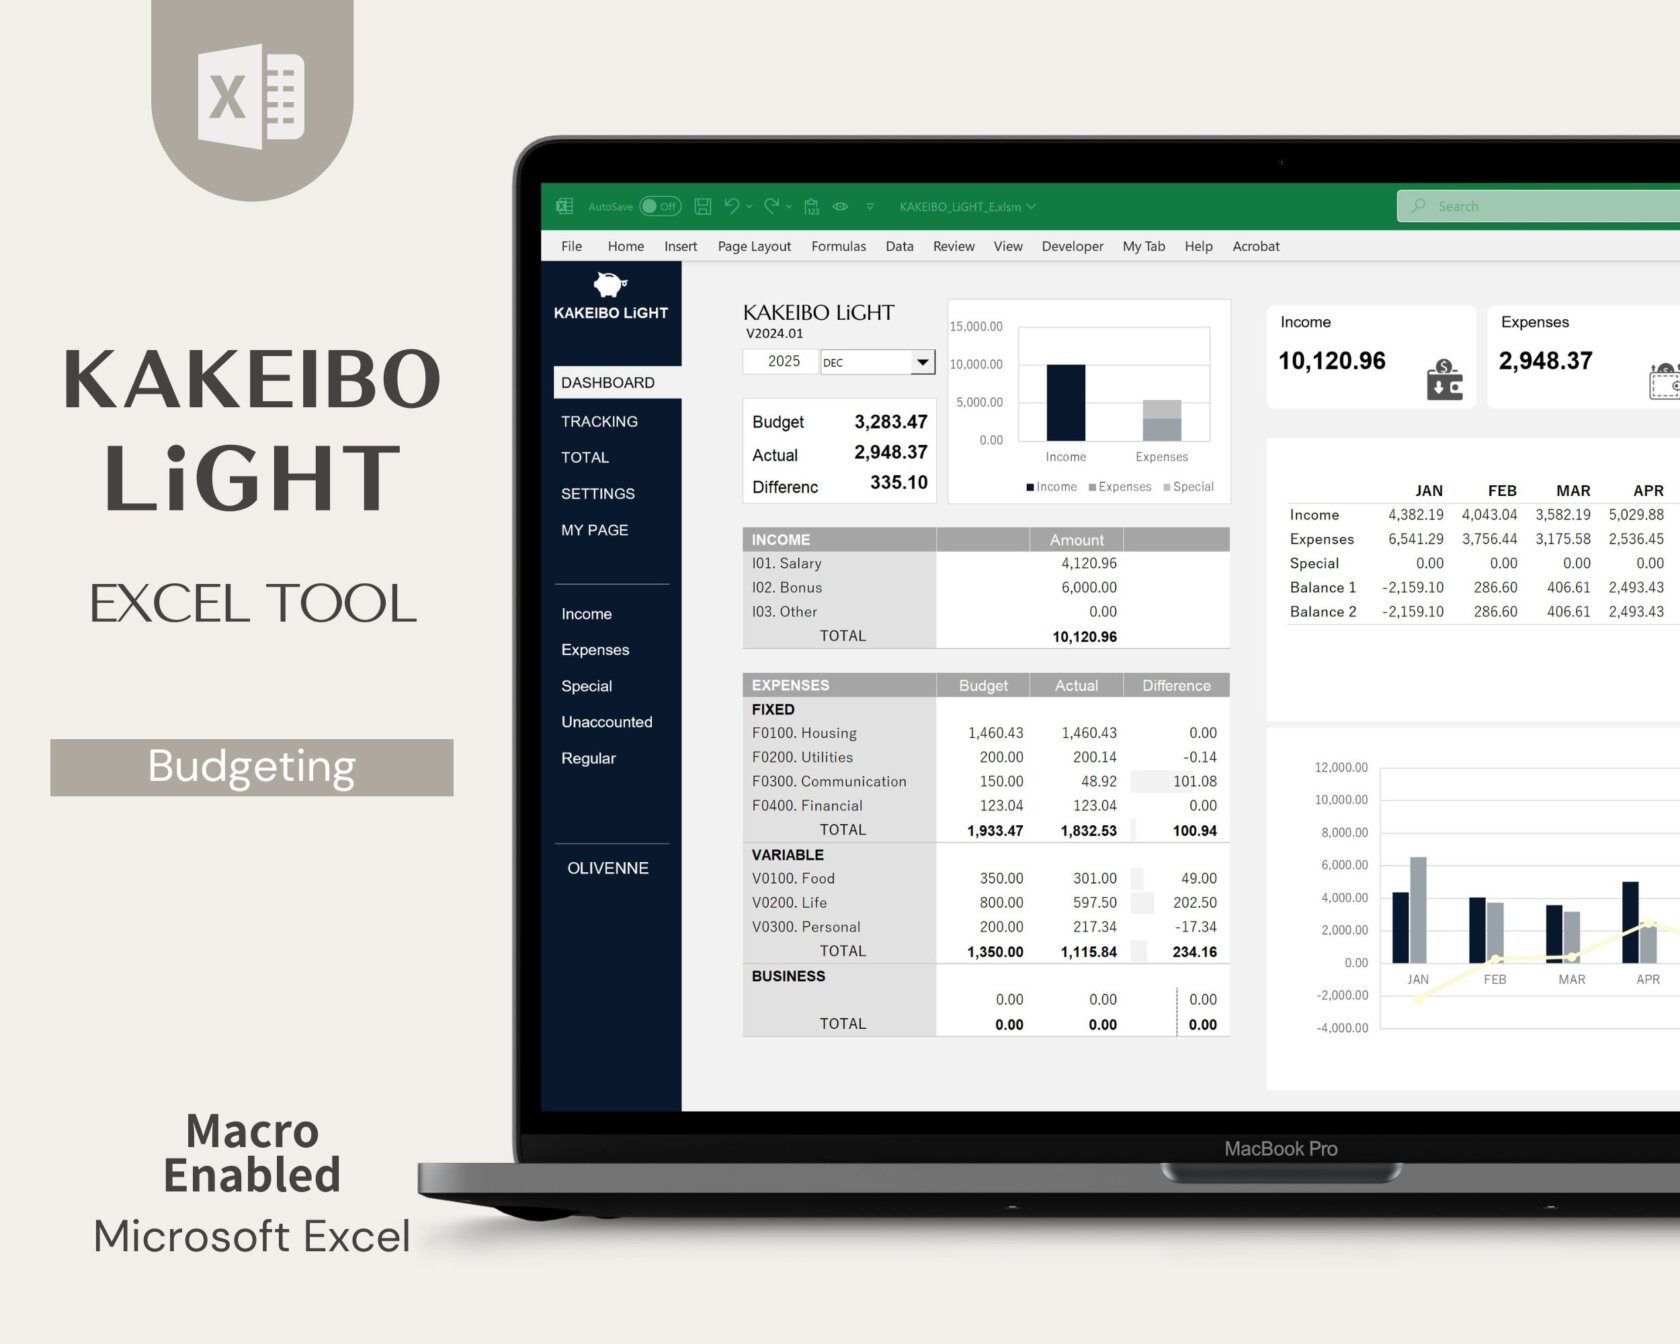
With that in mind, I’d like to introduce KAKEIBO PRO and KAKEIBO LiGHT, specially designed Excel household budget books that I created by combining years of personal budgeting experience with advanced Excel expertise.
In this article, I’ll explain how to make the most of the Monthly Aggregation Feature and Trend Analysis Feature, showing you how to identify unnecessary expenses, gain a clearer understanding of your spending patterns, and build a household budget that helps you save money consistently.
Language: English Japanese
1. Why Comparison and Analysis Are Essential for Budgeting
Are you satisfied simply with recording your income and expenses in a household budget book each day? Simply recording numbers does not automatically help you save money. The purpose of household budget management is to identify unnecessary spending and make meaningful improvements.
This is where comparison and analysis become essential. In this chapter, we’ll explore why comparison and analysis are so important in household budget management from three practical and easy-to-understand perspectives.
1-1. Grasp the Situation Objectively Through Comparison
I’m somehow running a deficit every month, but what exactly am I spending too much money on?
In reality, even if you closely examine this month’s spending figures, it can be very difficult to determine whether they are too high or reasonable. This is where comparison with past data becomes essential.
For example, let’s say your Food Expenses this month totaled $600. Looking at that figure alone, you may not know whether it is high or low. However, if you compare it with last month’s Food Expenses of $500, you can immediately recognize the objective fact that you spent $100 more this month.
Moving beyond simply recording your expenses and reviewing your finances based on objective numerical data is the first step toward developing smarter, more efficient spending habits.
1-2. Identify Areas for Improvement Through Analysis
My Food Expenses have increased, but what should I do differently next month?
This is a natural question to ask once you’ve compared your spending and noticed a change. However, simply recognizing that your expenses have increased is not enough to improve your finances. The step of analysis, in which you deeply investigate why it costs so much money, is indispensable.
For example, suppose you discover that your Food Expenses were $100 higher than the previous month. By reviewing the details, you may uncover specific reasons, such as eating out with your family more often on weekends or buying snacks at a convenience store every day on your way home from work.
Once you identify the causes, practical solutions become much easier to find. You might decide to reduce family meals out by one occasion next month or limit convenience store visits to once a week.
Rather than relying solely on willpower and telling yourself, “I need to save more money,” you can take focused, data-driven actions that effectively reduce unnecessary spending and improve your financial health.
1-3. Gain Insights at a Glance Through Visualization
Looking at a screen filled with rows of numbers is enough to make my head spin…
Carefully examining countless rows of figures in a spreadsheet can be overwhelming and time-consuming. Even if you understand the importance of comparison and analysis, staying motivated can be difficult when you’re faced with nothing but numbers. This is where data visualization becomes invaluable.
By transforming numerical data into charts and graphs, you can understand the state of your finances far more quickly and intuitively. For example, a simple line graph can immediately reveal trends such as Utility costs gradually increasing as winter approaches.
When you can see changes in your spending patterns at a glance, it becomes much easier to identify issues, track progress, and stay motivated to improve your household budget. After all, a picture often reveals what pages of numbers cannot.
2. Grasp Your Finances with the Monthly Aggregation

After recording your income and expenses, reviewing exactly how much you spent, and where you spent it is the foundation of effective household budget management. In this chapter, I’ll introduce the powerful Monthly Aggregation Feature included in the Excel household budget tool, KAKEIBO PRO / LiGHT.
With this feature, you can instantly see how your actual spending compares with your planned budget and track changes in your spending patterns over time.
I will show you how to objectively understand the actual condition of your household budget each month by comparing it with your planned budget and past financial records, and how to turn those insights into actionable steps for the next month.
2-1. Compare Your Budget and Actual Spending by Category
At the beginning of every month, I set a budget and tell myself, “I’ll keep my Food Expenses under $800 this month!” But by the end of the month, I lose track of how much I actually overspent. Is there an easy way to check?
The answer to this common concern is the Budget vs. Actual Comparison included in the Monthly Aggregation Feature of KAKEIBO PRO / LiGHT. Its primary purpose is to help you objectively check whether your spending aligned with the budget you originally planned.
One of its most useful benefits is that you can instantly see the exact difference between your budgeted and actual spending for each category, such as Food, Household Necessities, and Transportation. For example, you can immediately identify results such as:
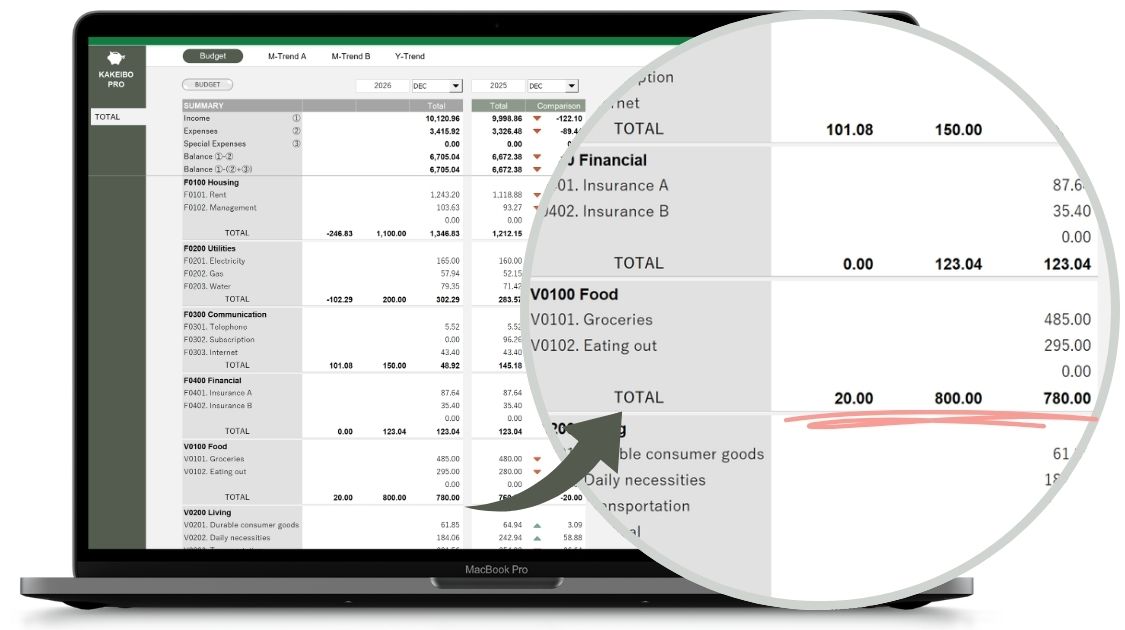
| Food Expenses | Budget $800 → Actual $780 → Under budget by $20 |
| Transportation | Budget $100 → Actual $120 → Over budget by $20 |
By clearly highlighting which categories exceeded their budgets, the feature makes it easy to identify areas that need attention. You can then take specific actions, such as reducing the number of restaurant visits next month to offset excess food spending.
This enables you to make timely adjustments to your spending habits and keep your household budget on track.
POINT
You can objectively compare your actual spending against your planned budget for each category. Since categories that have exceeded their budgets can be identified instantly, you can quickly develop specific action plans and adjustments for the following month.
2-2. Compare the Current Month with Previous Months and Years
This month’s electricity bill seems unusually high. Did I simply use more electricity than usual, or is it because winter has arrived and I’ve started using the heater? How can I tell the difference?
The feature that compares the current month with other months and years is designed to answer questions like these. By comparing your current spending with data from previous months and years, it helps you quickly identify unusual changes and understand the impact of seasonal trends on your household finances.
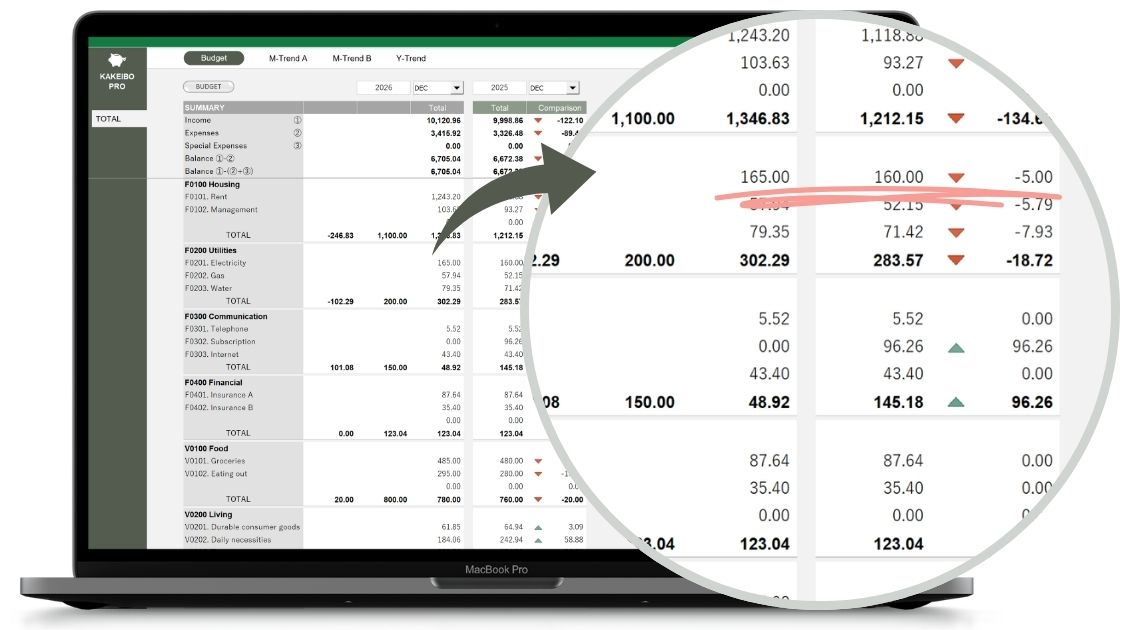
For example, suppose your electricity bill this December is $165. If you compare it only with November’s bill of $115, you might be alarmed by the $50 increase. However, if you also compare it with last December’s bill of $160, you’ll see that your current spending is actually in line with normal winter usage. This allows you to distinguish between seasonal fluctuations and genuine overspending.
POINT
Comparing this month’s expenses with those from the previous month and the same month last year helps you identify seasonal patterns, lifestyle changes, and unusual spending trends.
With reliable historical data as a reference point, you can evaluate your finances more objectively and respond to changes with confidence.
3. Uncover Long-Term Spending Patterns with the Trend Analysis

As you continue using a household budget book over months and years, you’ll begin to notice long-term spending patterns that aren’t visible in monthly summaries alone. In this chapter, I’ll introduce another powerful feature of KAKEIBO PRO / LiGHT: the Trend Analysis Feature.
This feature helps you connect financial data into a clear, long-term view of your household’s cash flow. By visualizing spending and income trends over time, you can easily identify seasonal fluctuations, recurring patterns, and gradual changes in your financial habits.
3-1. Monthly Trend A
Utility Bills and Clothing Expenses vary greatly depending on the season. Is there an easy way to see at a glance when expenses are likely to increase and how much I should expect to spend?
When you want to understand the spending patterns of a specific item, Monthly Trend A (Multi-Year Comparison of a Single Expense Item) is an extremely useful tool. This feature allows you to focus on a single expense item and compare its month-by-month spending trends across multiple years, making it easier to identify seasonal patterns as well as year-over-year changes.
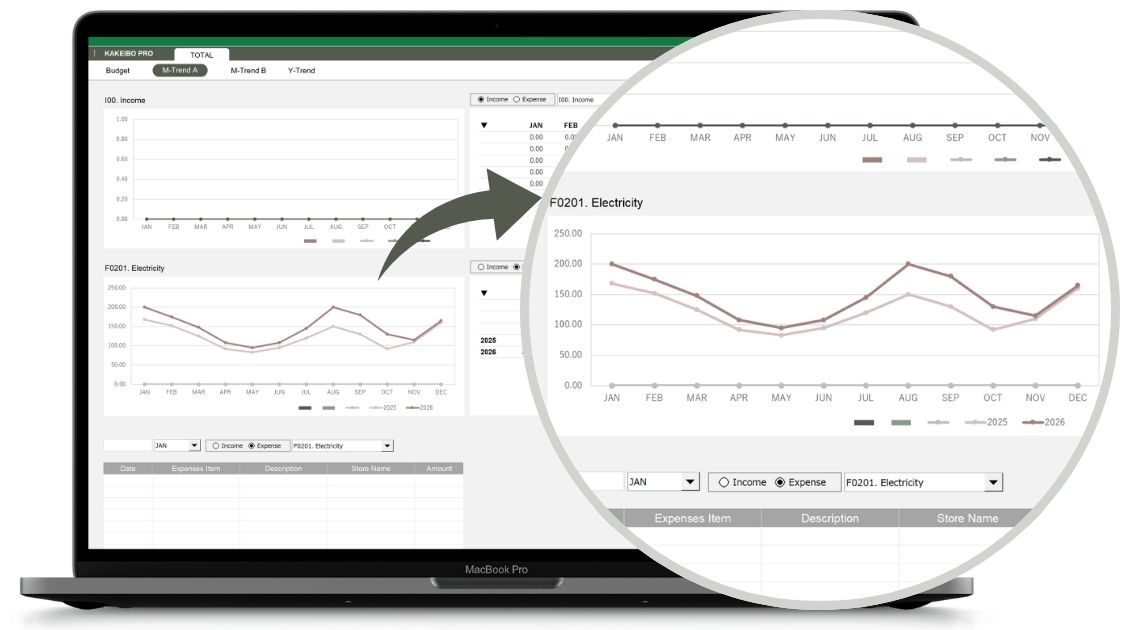
For example, if you select Utility Bills, spending trends from January through December are displayed instantly. By simply looking at the peaks and valleys in the graph, you can quickly identify patterns such as, “Electricity costs consistently peaking in January and August due to heating and air conditioning usage.”
The feature also allows you to compare the current year’s data with previous years. By overlaying multiple years on the same graph, you can easily spot changes such as, “This summer’s electricity bill was $50 higher than it was last summer.”
If you know in advance that certain expenses tend to increase in specific months each year, you can set aside money ahead of time for those months. This makes it much easier to manage your household budget and stay on top of your finances.
POINT
Analyze the long-term trend of a specific expense item using intuitive charts and graphs. Seasonal spending patterns and year-over-year changes become immediately visible, helping you anticipate future expenses and prepare your budget accordingly.
3-2. Monthly Trend B
Lately, it feels like we’ve been eating out more often on weekends, but have our Grocery Expenses decreased to offset that increase? How can I check the balance between different types of spending?
When you want to understand how different expense items relate to one another, Monthly Trend B (Monthly Comparison of Multiple Expense Items) is a valuable analytical tool. This feature allows you to compare multiple expense items side by side over the same period, making it easy to see at a glance how each item has increased or decreased over time.
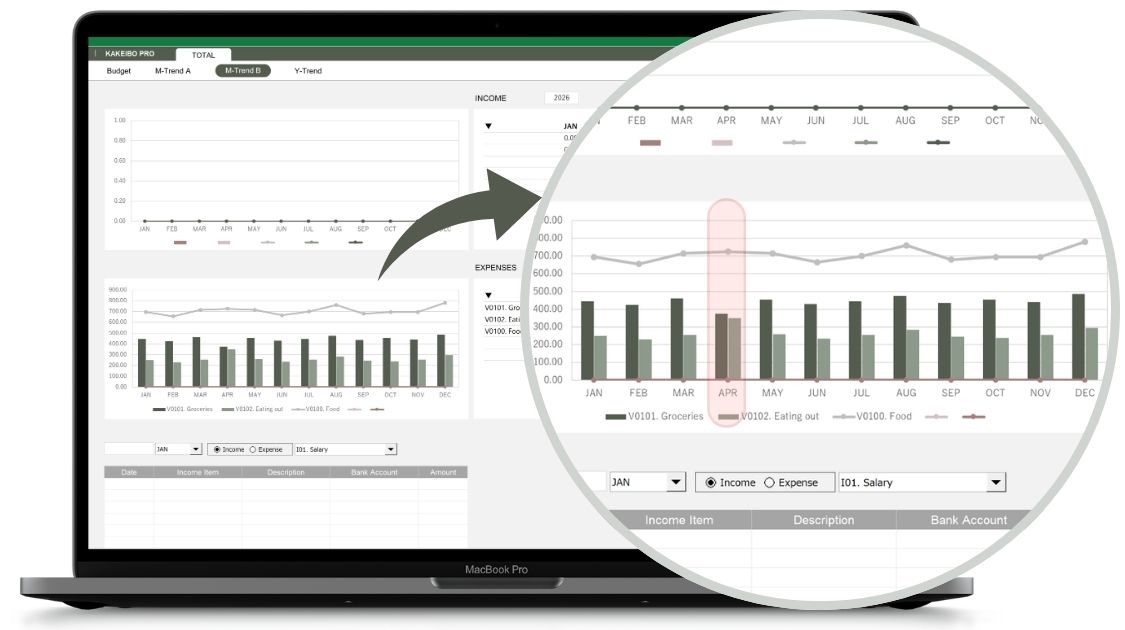
For example, you can display both Dining-out Expenses and Grocery Expenses on the same chart. If you notice that Grocery Expenses tend to decrease during months when Dining-out Expenses increase, you can conclude that your Food budget is simply shifting between items rather than increasing overall. This helps you determine whether changes in spending habits are actually affecting your total budget.
By analyzing multiple spending items together, you can gain a more accurate understanding of your spending patterns. This allows you to objectively see where your money is being spent and where savings are already being achieved. As a result, you can manage your budget more effectively and maintain a healthier overall balance in your household finances.
POINT
Compare multiple expense items on a single chart to identify relationships and shifts in spending patterns.
By analyzing items such as Dining-out Expenses and Grocery Expenses together, you can objectively evaluate lifestyle changes and better understand how your spending balance evolves over time.
3-3. Annual Trend
I feel like our food-related expenses have been gradually increasing year by year, but is it because I’m spending more at the supermarket, or because we’re eating out more often on weekends? How can I identify these long-term changes?
When you want to understand how your spending habits have changed over the years, the Yealy Trend (Annual Comparison of Multiple Categories) feature can be extremely useful. This feature is designed to compare and analyze the long-term annual trends of multiple expense items side by side.
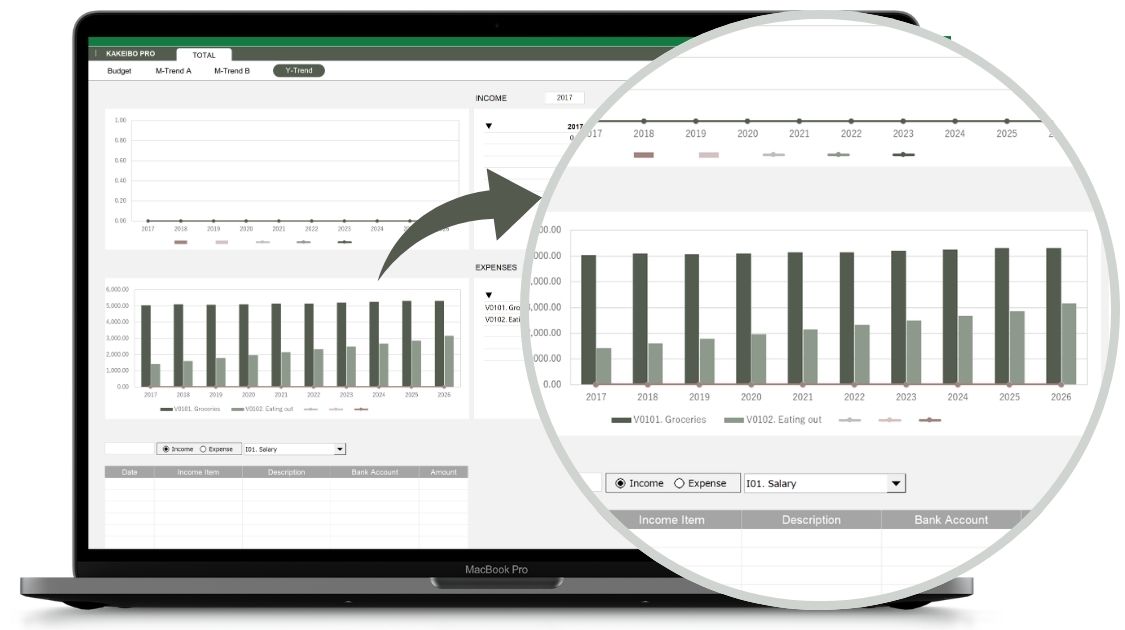
For example, you can display Grocery Expenses and Dining-out Expenses on the same graph. Doing so allows you to quickly identify meaningful trends, such as, “Grocery Expenses have remained relatively stable over the years, while Dining-out Expenses have steadily increased.”
Once you can see these patterns, it becomes much easier to understand how specific items affect your overall household budget. You may realize, for example, that rising Dining-out Expenses are one of the main reasons your total household spending has gradually increased over time.
This insight can help you make realistic and effective lifestyle adjustments, such as reducing the number of times you eat out on weekends and preparing more special meals at home instead. By understanding long-term spending trends across multiple years, you can make better-informed decisions and discover more effective ways to improve your household finances.
POINT
Compare the long-term annual trends of multiple expense items using intuitive charts and graphs.
By reviewing your spending patterns over the years, you can more easily identify major changes that may not be apparent from monthly summaries alone, as well as expense items that are gradually putting pressure on your household budget.
4. Conclusion

A household budget book is much more than a tool for recording your daily income and expenses. The real value comes from comparing your current spending with past results and your planned budget, then analyzing why certain expenses increased or decreased. Only through this process can you identify practical opportunities to save money and improve your financial habits.
With KAKEIBO PRO / LiGHT, you can perform these comparisons and analyses without any complicated calculations. The Monthly Aggregation Feature allows you to quickly identify differences between your budgeted and actual spending, as well as changes from previous months. Meanwhile, the Trend Analysis Feature uses clear, easy-to-read charts to help you visualize seasonal spending patterns and track your financial progress over time.
Even if you’re not comfortable analyzing rows of numbers, graphs make it easy to understand the state of your household finances at a glance. Why not give KAKEIBO PRO / LiGHT a try and start building a more organized, stress-free, and rewarding approach to household budget management today?
Related Articles